
|
Summary Show |
IndustryWatch is a tool provided at no charge to existing StatWatch customers. This service lets you compare your wash's performance to current industry averages and benchmark against your peers.
a. From StatWatch.
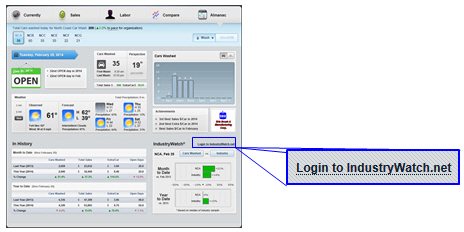
i. Navigate to the StatWatch Almanac page.
ii. In the bottom right section of the screen, click Login to IndustryWatch.net.
iii. Your site's
IndustryWatch page appears.
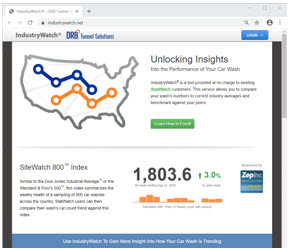
b. By entering the IndustryWatch website address.
i. Open an Internet browser. The screen shots in this topic were taken using Internet Explorer, but the screen contents are the same regardless of which browser you use.
ii. In the address bar, type www.industrywatch.net. The page that appears varies based on whether you're already signed in to IndustryWatch. Note that if you are signed in to StatWatch, even if you don't have a StatWatch window/tab open, you are automatically signed in to IndustryWatch as well.
|
|
Not Logged In |
Logged In |
a. Click the Login button on the top right of the screen. The IndustryWatch Login screen appears.
b. Enter your login information. It is the same as your StatWatch login information.
c. Click Sign In. You are logged in to IndustryWatch and your site's IndustryWatch page appears.
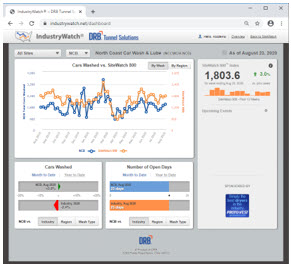
a. Site Picker

i. The Site Picker button allows you to choose which site within your organization you want to view comparison data for.
b. Cars Washed
vs. SiteWatch 800 Index graph
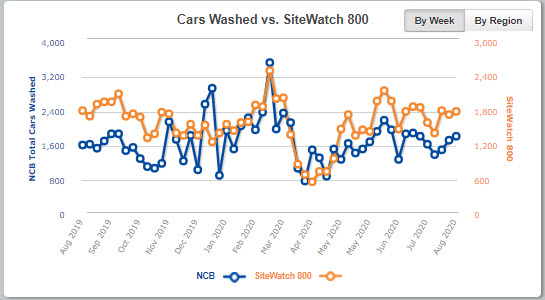
i. Two sets of data are shown on this graph - data for your site and data for the SiteWatch 800™ Index - for each of the past 52 weeks.
ii. It is important to note that two separate sets of data are being shown here. The numbers on the left axis show the total cars washed for your site. The numbers on the right axis show the average total cars washed by the SiteWatch 800. However the numbers on the left axis will likely NOT be the same as the numbers on the right axis.
· For instance, in the screen shot above, the maximum number of cars washed by the site was less than 1,000 cars per week, however, the SiteWatch 800's max average was just under 2,000 cars per week. The graph just shows how this site performed relative to the industry as a whole.
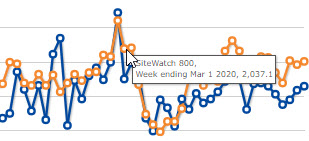
iii. Hovering
the cursor over any of the entries on this graph shows detailed information.
c. Cars Washed
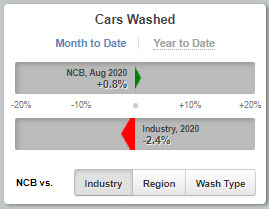
i. This section shows your total cars washed compared to the average total cars washed in the industry, region, or at your wash type.
ii. This can be shown in Month-to-Date or Year-to-Date format.
iii. IndustryWatch requires that there are at least 100 sites in the sample. If there are less than 100 sites in the selected region or wash type, the industry data will not be displayed.
d. Number
of Open Days
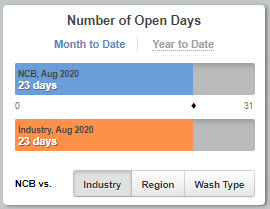
i. This section shows your total days open compared to the average total days open in the industry, region, or at your wash type.
ii. As with the Cars Washed graph, IndustryWatch requires that there are at least 100 sites in the sample. If there are less than 100 sites in the selected region or wash type, the industry data will not be displayed.
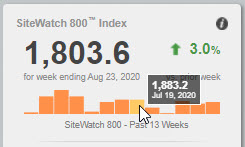
e. SiteWatch
800 Index
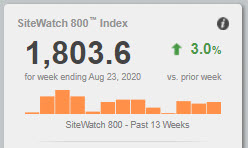
i. As in the "Cars Washed vs. SiteWatch 800 Index" graph, the weekly health of a sampling of 800 carwashes across the country is shown in this section.
ii. Each bar
represents the average number of cars washed for the SiteWatch 800 Index
over the past 13 weeks. Hovering the cursor over any of the bars here
shows detailed information.
|
Bigger Picture |
Document Number: SW0325-0314 |
Last Updated: 10/21/14 |
For Version: SiteWatch 2014 |
| Includes information from former doc: "IndustryWatch Information" (Sol doc # 31492-0613) | ||