

|
Summary Show |
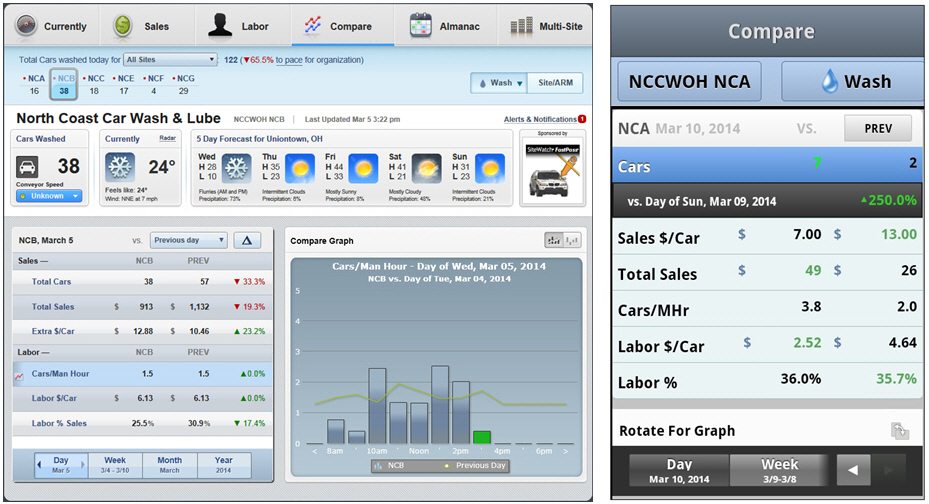
This topic describes the Compare tab in StatWatch. The Compare tab allows organizations to compare the data from this site to another site or from one time period to another time period. In the example above, today's total cars washed are being compared to yesterday's total cars washed.
This document assumes that your security level (configured on the StatWatch Settings: Users screen) is Administrator. If you're not an administrator, you might not be able to see some of the data described. Note that other user settings also affect what data users see. For instance, if a user is configured to be able to see total sales dollars, they're also configured to NOT see some other value - such as extra dollars per car.
StatWatch Mobile App: The app is very similar to the web console, but any significant differences are noted below. Note that when using the StatWatch Mobile app, turning the device on its side allows you to view graphs, if they're available.
When this topic refers to "base" value, it means the value being used as the basis for comparison. The base value is determined by three factors: the selected site, the selected profit center, and the selected date range. The base value is always the currently selected site, the currently selected profit center, and the current date or date range. No matter which range you choose, the base value always includes the current date. If you choose Day for the period, the base day will be today's date. If you choose Week, the base week will begin seven days ago and end today.
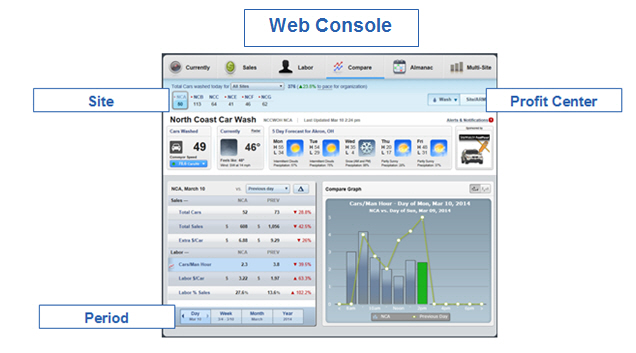
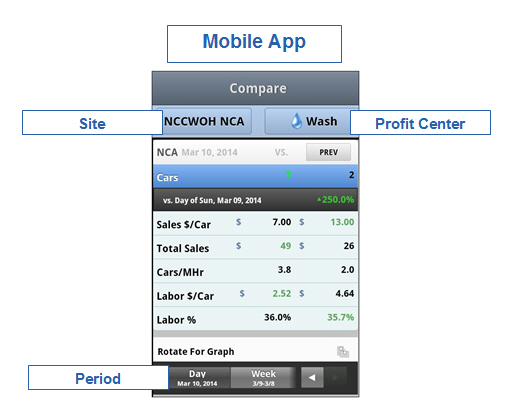
The comparison value is selected using the button after the word vs. You can compare against other time periods or other sites using the options in this drop-down.
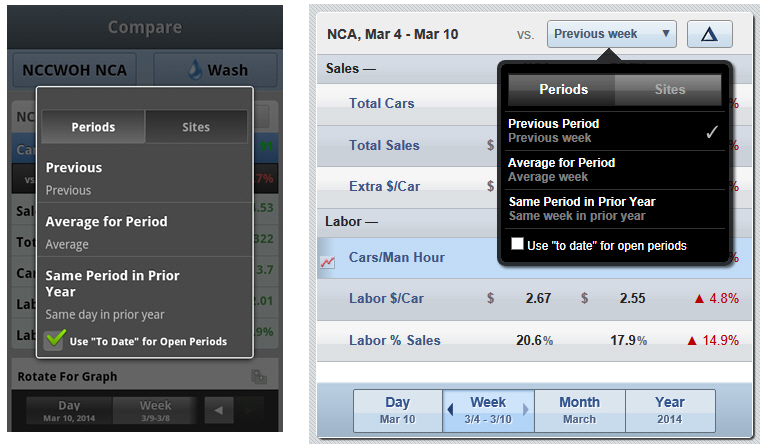

This button only exists for the StatWatch web console. This button allows users to specify the format in which data appears in the column under the Delta button. This button allows the site to configure the following options.
Percent Difference: The difference in the values as a percentile.
Value Difference: Shows the difference in the values as a positive or negative numbers, such as dollars or counted car numbers.
Flip Comparison: Allows the user to change the perspective of the comparison. Selecting this subtracts the base value from the comparison value. Clearing this check box subtracts the comparison value from the base value.
The graph on this page shows the comparison data for whatever line is selected/highlighted. For example, if the Total Cars line is selected, then the graph compares the number of total cars washed. If the Cars/Man Hour is selected instead, the graph compares the cars per man hour.
|
|
Bigger Picture |
|
Document Number: SW0351-0314 |
Last Updated: 10/21/14 |
For Version: StatWatch 2.3 |
|
Includes information from former docs:
|
||

