

|
Summary Show |
This topic describes the Sales tab in StatWatch.
This document assumes that your security level (configured on the StatWatch Settings: Users screen) is Administrator. If you're not an administrator, you might not be able to see some of the data described. Note that other user settings also affect what data users see. For instance, if a user is configured to be able to see total sales dollars, they're also configured to NOT see some other value - such as extra dollars per car.
StatWatch Mobile App: The app is very similar to the web console, but any significant differences are noted below. Note that when using the StatWatch Mobile app, turning the device on its side allows you to view graphs, if they're available.
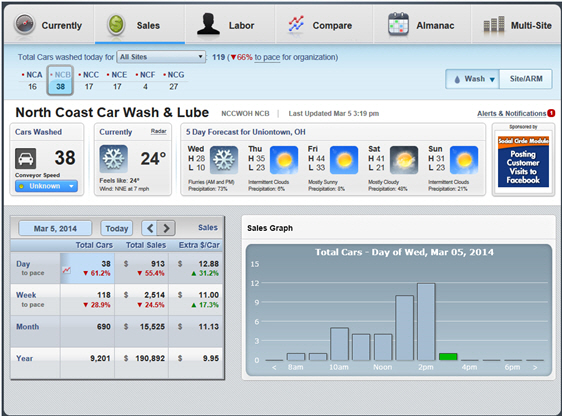
The Sales tab lets you see data and graphs about this site or profit center's performance over time. You can click each of the squares (or rows, in the case of StatWatch Mobile) to see the data represented on a graph.
On the StatWatch web console, you see data for day, week, month, and year all in one table. On StatWatch Mobile, you have to select Day, Week, Month, or Year by pressing the appropriate button below the graph. To see the buttons for month and year, place your finger on the Day or Week button and swipe left.
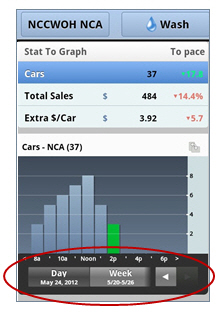
The graph on this page shows the sales data for whatever line is selected/highlighted. For instance, in the web console, if the box selected is the one in the Total Cars column and Year row, then the graph shows car count data for the past year. On StatWatch mobile, if you've selected Week in the box below the graph and tapped the Extra $/Car line, the graph shows extra dollars per car data for the last week.
The Total Cars column of the table shows the total number of customers that purchased at least one item from this profit center that belongs to the STAT-Total Cars group.
The Total Sales is the total number of dollars taken in by the profit center in the period. Note: This statistic is only available if the user has the security settings to allow it.
The Sales $/Car is the total dollars spent on items from this profit center, divided by the counted cars for this profit center.
The Extra $/Car is the number of dollars spent on items from this profit center that belong to the STAT-Extra Service group, divided by the counted cars for this profit center.
|
|
Bigger Picture |
|
Document Number: SW0349-0314 |
Last Updated: 10/21/14 |
For Version: StatWatch 2.3 |
|
Includes Information from Former Docs:
|
||

