
|
Summary Show |
This topic describes the Labor tab in StatWatch.
|
|
|
This document assumes that your security level (configured on the StatWatch Settings: Users screen) is Administrator. If you're not an administrator, you might not be able to see some of the data described. Note that other user settings also affect what data users see. For instance, if a user is configured to be able to see total sales dollars, they're also configured to NOT see some other value - such as extra dollars per car.
StatWatch Mobile App: The app is very similar to the web console, but any significant differences are noted below. Note that when using the StatWatch Mobile app, turning the device on its side allows you to view graphs, if they're available.
Note that StatWatch also features Red Zone Alerts, which allow users to receive mobile notifications about labor usage. For more information about Red Zone Alerts, see "StatWatch Settings: My Account".
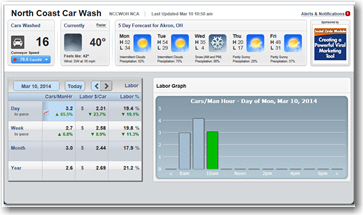
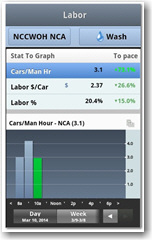
The Labor tab lets you see data and graphs about labor usage over time. This screen shows you data about cars per man hour, labor dollars per car, and labor percentages. You can click each of the squares (or rows, in the case of StatWatch Mobile) to see the data represented on a graph.
On the StatWatch web console, you see data for day, week, month, and year all in one table. On StatWatch Mobile, you have to select Day, Week, Month, or Year by pressing the appropriate button below the graph. To see the buttons for month and year, place your finger on the Day or Week button and swipe left.
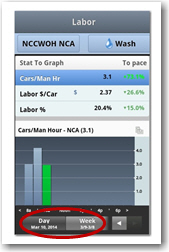
The graph on this page shows the labor data for whatever line is selected/highlighted. For instance, in the web console, if the box selected is the one in the Cars/Man Hr column and Year row, then the graph shows cars per man hour data for the past year. In StatWatch mobile, if you've selected Week in the box below the graph and touched the Labor % line, the graph shows you labor percentage data for the past week.
In StatWatch, all labor calculations use the total cars (cars that purchased at least one item from the STAT-Total Cars group) to calculate labor statistics. However, in SiteWatch reports, the value in the Total Cars in Labor? field of the System editor of Site Manager determines whether labor statistics will be calculated based on total cars or counted cars (cars that purchased at least one item from the STAT-Counted Cars group). As a result, if the Total Cars in Labor? field is set to No, StatWatch labor statistics will differ from SiteWatch labor statistics. To avoid this, change the value in the Total Cars in Labor? field to Yes.
The Cars/ManHr is the total cars serviced for the profit center divided by the total labor hours for the profit center.
The Labor $/Car is the total labor dollars divided by the total cars for the profit center.
The Labor % is the total cost of all the labor for this profit center compared to the total sales for the profit center.
|
|
Bigger Picture |
|
Document Number: SW0350-0314 |
Last Updated: 06/05/15 |
For Version: StatWatch 2.4 |
|
Includes Information from Former Docs:
|
||