Document Number: SW0347-0314
Last Updated: 02/10/16

|
Summary Show |
This topic briefly describes each of the reporting tabs in StatWatch and links to more detailed information.
This document assumes that your security level (configured on the StatWatch Settings: Users screen) is Administrator. If you're not an administrator, you might not be able to see some of the data described. Note that other user settings also affect what data users see. For instance, if a user is configured to be able to see total sales dollars, they're also configured to NOT see some other value - such as extra dollars per car.
StatWatch Mobile App: The app is very similar to the web console, but any significant differences are noted below. Note that when using the StatWatch Mobile app, turning the device on its side allows you to view graphs, if they're available.
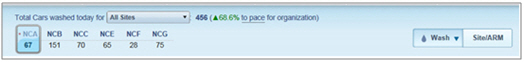
This section lets users select which site and profit center to view data for. This section appears regardless of which tab is selected.
Components:
Total Cars serviced today (to pace) data:
The drop-down in this section lets you pick the group of sites you want to view data for. You can view it for all sites or a subset of all the sites (the groups shown in this drop-down are configured on the StatWatch Settings: Organization page).
The "to pace" information compares the organization's current performance to its average performance. See the hover-over description in StatWatch for more specific information about where the numbers come from.
Site picker: One button exists for each site in the organization (although sites are only available to users who have been configured with access to multi-site data). The button includes:
3-digit location code
The total number of cars serviced by the selected profit center today
A red dot if there are any notifications for the site.
StatWatch Mobile App: If you're using the mobile app, the sites are listed in a drop-down instead of in a row.
Profit Center picker:
Clicking this button lets you select which profit center you want to view data for.
The Site/Arm button shows you ARM data, plus overall sales and labor data for all profit centers. This option can't be used on the Almanac tab.
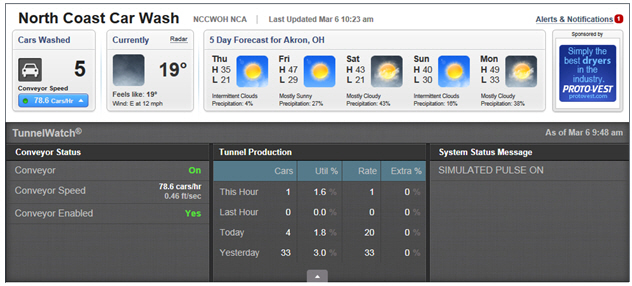
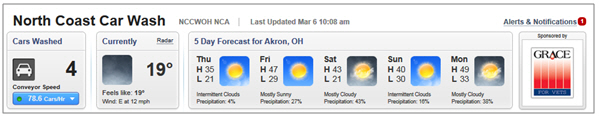
This section shows basic information about the currently selected site. Note: This section is not displayed in the Almanac tab.
Components
Site info: This displays the name and location code of the carwash along with the last updated time that the Data Collector got information from SiteWatch.
Alerts & Notifications: Clicking on this link shows a popup containing information about employee overtime as well as messages from TunnelWatch. The messages viewed here are the same as those described in "StatWatch Mobile Notifications Basics".
Cars Serviced: This shows the total number of cars serviced at this site for this profit center today.
If the site has StatWatch for TunnelWatch installed, this section also shows the conveyor speed. Clicking on the Conveyor Speed button causes more TunnelWatch information to appear.
Weather: Current weather plus the five day forecast from AccuWeather.com. Hovering the mouse over a weather icon makes more information appear. StatWatch Mobile App: On StatWatch Mobile, the weather information is only shown on the Currently tab, and only for the current date. However, if you tap on the weather icon, you'll see a five-day forecast along with a weather map from AccuWeather.com.
The Currently tab displays overall sales and labor statistics for the current day.
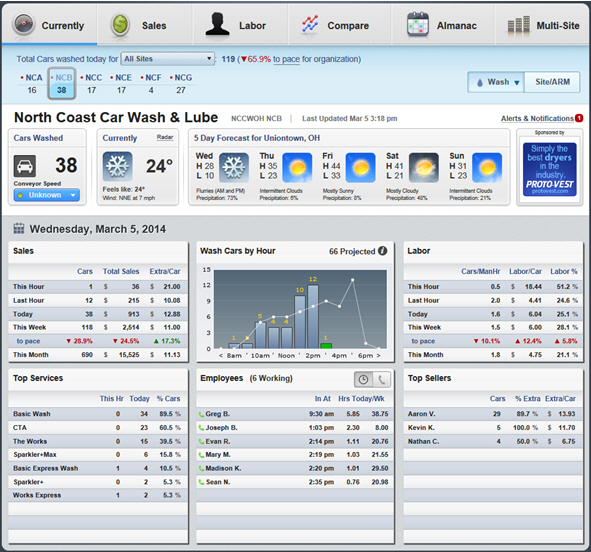
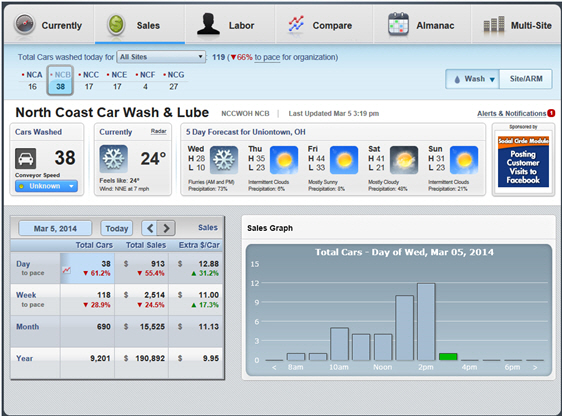
The Sales tab displays detailed sales statistics for a specified period.
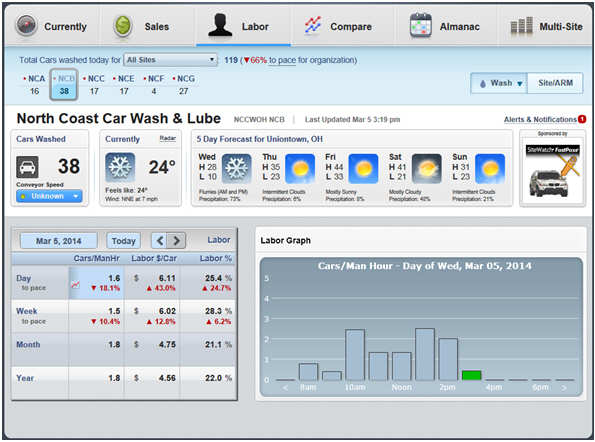
The Labor tab displays detailed labor statistics for a specified period.
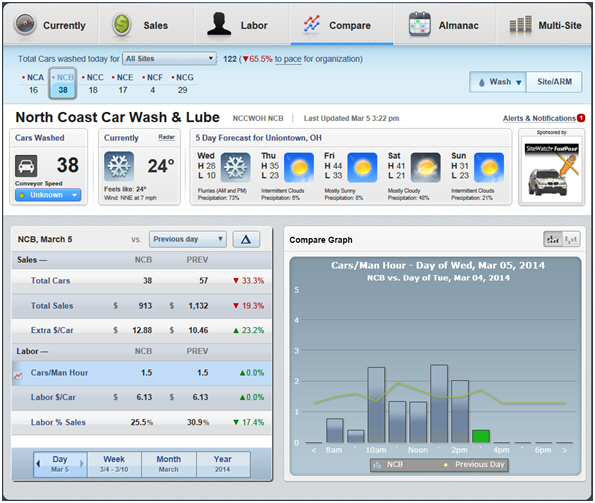
The Compare tab allows users to compare current sales data and statistics with previous periods' sales data and statistics.
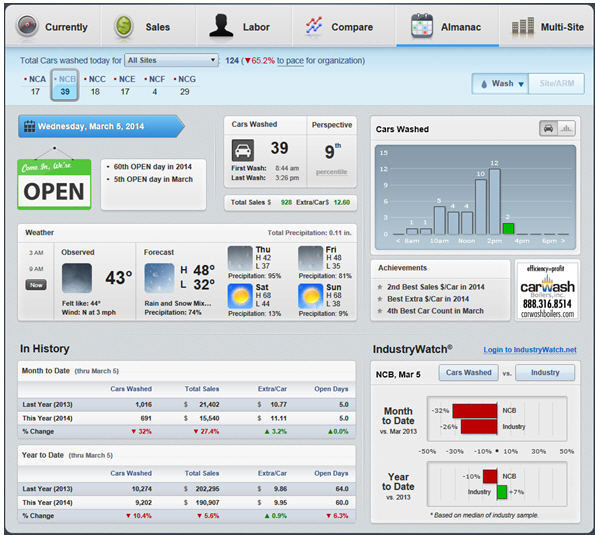
The Almanac tab provides at-a-glance weather, historical, and industry data for a specified date.
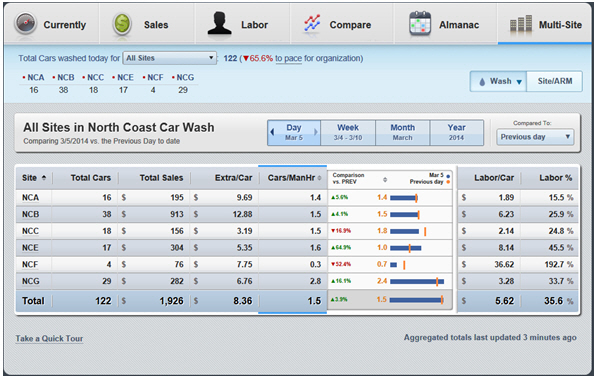
The Multi-Site tab, visible only to employees who are configured with permission to see data for all sites, shows data for all sites in the organization at once, allowing you to see all data side-by-side.
|
|
Bigger Picture |